SmartEPD-2025-068-0489-01.4Date of IssueJun 20, 2025Expiration DateJun 20, 2030Last UpdatedJun 08, 2026Refer to the EPD Library at www.smartepd.com for the latest EPD listing information
General InformationTnemechttps://tnemec.com/816-483-3400environmentalgroup@tnemec.comtnemec.comProduct Name:Series N242 Ultra-Tread SFunctional Unit:1 m2Declaration Number:SmartEPD-2025-068-0489-01.4Date of Issue:June 20, 2025Expiration:June 20, 2030Last updated:June 08, 2026EPD Scope:Cradle to graveA1 - A3, A4, A5, B1 - B7, C1 - C4, DMarket(s) of Applicability:North AmericaGeneral Organization InformationTnemec Company, Inc. specializes in protecting surfaces and structures from corrosion with high-performance coatings and linings. However, we know ourcustomers equally value the protection our coatings and linings provide to their investments, their reputation, and their clients. Founded in 1921, Tnemec isone of the largest privately held protective coatings manufacturers in North America. Our coatings protect surfaces from Los Angeles to Philadelphia,Shanghai to San Juan, and every order we make is delivered with the expertise of our veteran team and the history they carry with them. Tnemec isheadquartered in North Kansas City, Mo., and manufactures a full range of protective coating products at facilities in North Kansas City, Mo., Baltimore, Md.,and Shanghai, China. Tnemec’s North American customers are serviced by distribution facilities in Atlanta, Dallas, Indianapolis, New Orleans, Seattle andCompton, California. Our independent representatives help with the specification and application of our coatings worldwide.Further information can be found at:https://tnemec.com/about/Limitations, Liability and OwnershipEnvironmental declarations from different programs (ISO 14025) may not be comparable. Comparison of the environmental performance of products usingEPD information shall be based on the product’s use and impacts at the building level, and therefore EPDs may not be used for comparability purposes whennot considering the whole building life cycle. EPD comparability is only possible when all stages of a life cycle have been considered. However, variations anddeviations are possible. Example of variations: Different LCA software and background LCI datasets may lead to differences results for upstream ordownstream of the life cycle stages declared. The EPD owner has sole ownership, liability, and responsibility for the EPD.Reference StandardsStandard(s):ISO 14025 and ISO 21930:2017PCR:NSF PCR for Resinous Floor Coatings v.1eSeries N242 Ultra-Tread STnemecPage 2 / 18
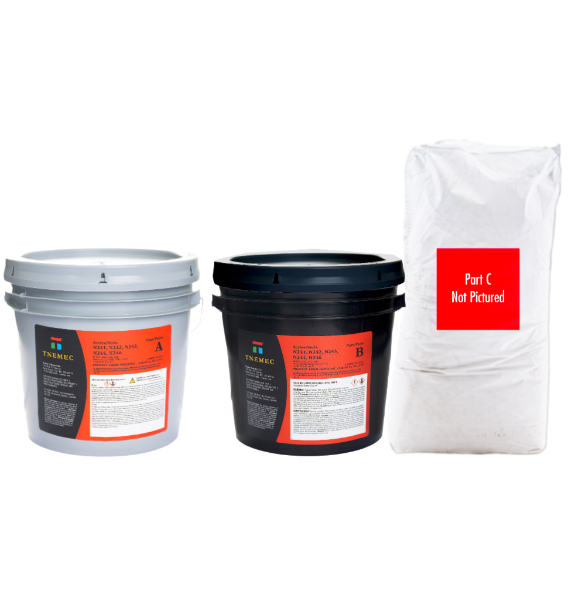
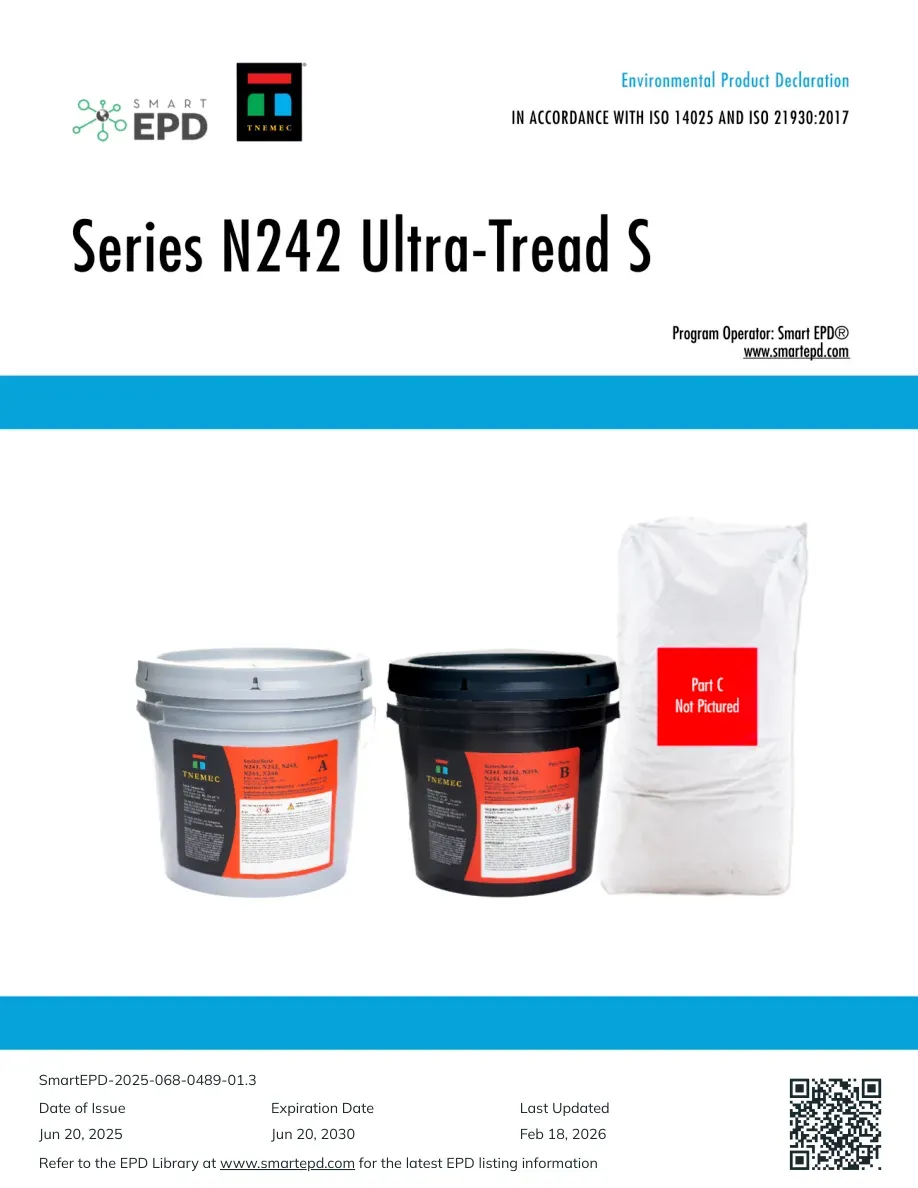
Date of issue: December 17, 2018Valid until: December 31, 2025PCR review panel:Contact Smart EPD for more information.General Program Instructions:Smart EPD General Program Instructions v.2.0, March 2025Verification InformationLCA Author/Creator:Seth RogersPARQseth@parqhq.comEPD Program Operator:Smart EPDinfo@smartepd.comwww.smartepd.com585 Grove St., Ste. 145, Herndon, VA 20170, USAVerification:Independent critical review of the LCA and data, according to ISO 14044 andISO 14071:ExternalRifat KarimIndependent Consultantrifat.chimique@gmail.comIndependent external verification of EPD, according to ISO 14025 andreference PCR(s):ExternalRifat KarimIndependent Consultantrifat.chimique@gmail.comProduct InformationFunctional Unit:1 m2Mass:11.9126 kgReference Service Life:60 YearsProduct Specificity:Product AverageProduct SpecificRepresentative Product EPDProduct DescriptionSeries N242 is a low-odor, slurry-applied, flowable mortar floor topping designed for monolithic applications in abusive service areas. It provides superiorperformance to other flooring systems such as acid brick, quarry tile, and most polymer flooring systems. Designed for use in food and beverage facilities,pharmaceutical and processing areas, commercial and restaurant kitchens, or anywhere a durable floor topping is required. Provides excellent chemicalresistance and withstands thermal shock due to hot liquids and aggressive cleaning procedures.Further information can be found at:https://www.tnemec.com/products/series-n242-ultra-tread-s/Series N242 Ultra-Tread STnemecPage 3 / 18
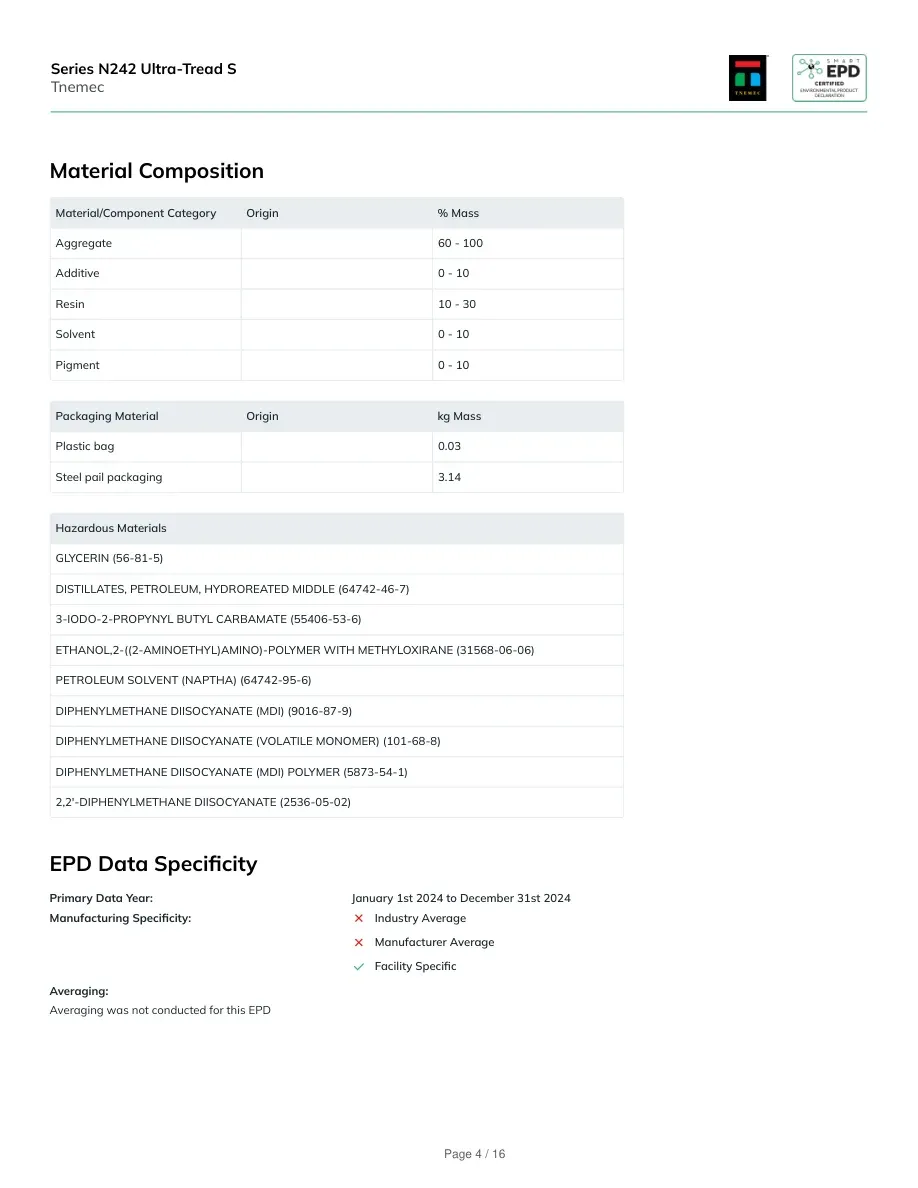
Product SpecificationsProduct Classification Codes:EC3 - Finishes -> Flooring -> OtherFlooringMaterial CompositionMaterial/Component CategoryOrigin% MassAggregate60 - 100Additive0 - 10Resin10 - 30Solvent0 - 10Pigment0 - 10Packaging MaterialOriginkg MassPlastic bag0.03Steel pail packaging3.14Hazardous MaterialsGLYCERIN (56-81-5)DISTILLATES, PETROLEUM, HYDROREATED MIDDLE (64742-46-7)3-IODO-2-PROPYNYL BUTYL CARBAMATE (55406-53-6)ETHANOL,2-((2-AMINOETHYL)AMINO)-POLYMER WITH METHYLOXIRANE (31568-06-06)PETROLEUM SOLVENT (NAPTHA) (64742-95-6)DIPHENYLMETHANE DIISOCYANATE (MDI) (9016-87-9)DIPHENYLMETHANE DIISOCYANATE (VOLATILE MONOMER) (101-68-8)DIPHENYLMETHANE DIISOCYANATE (MDI) POLYMER (5873-54-1)2,2'-DIPHENYLMETHANE DIISOCYANATE (2536-05-02)EPD Data SpecificityPrimary Data Year:January 1st 2024 to December 31st 2024Manufacturing Specificity:Industry AverageManufacturer AverageFacility SpecificSeries N242 Ultra-Tread STnemecPage 4 / 18
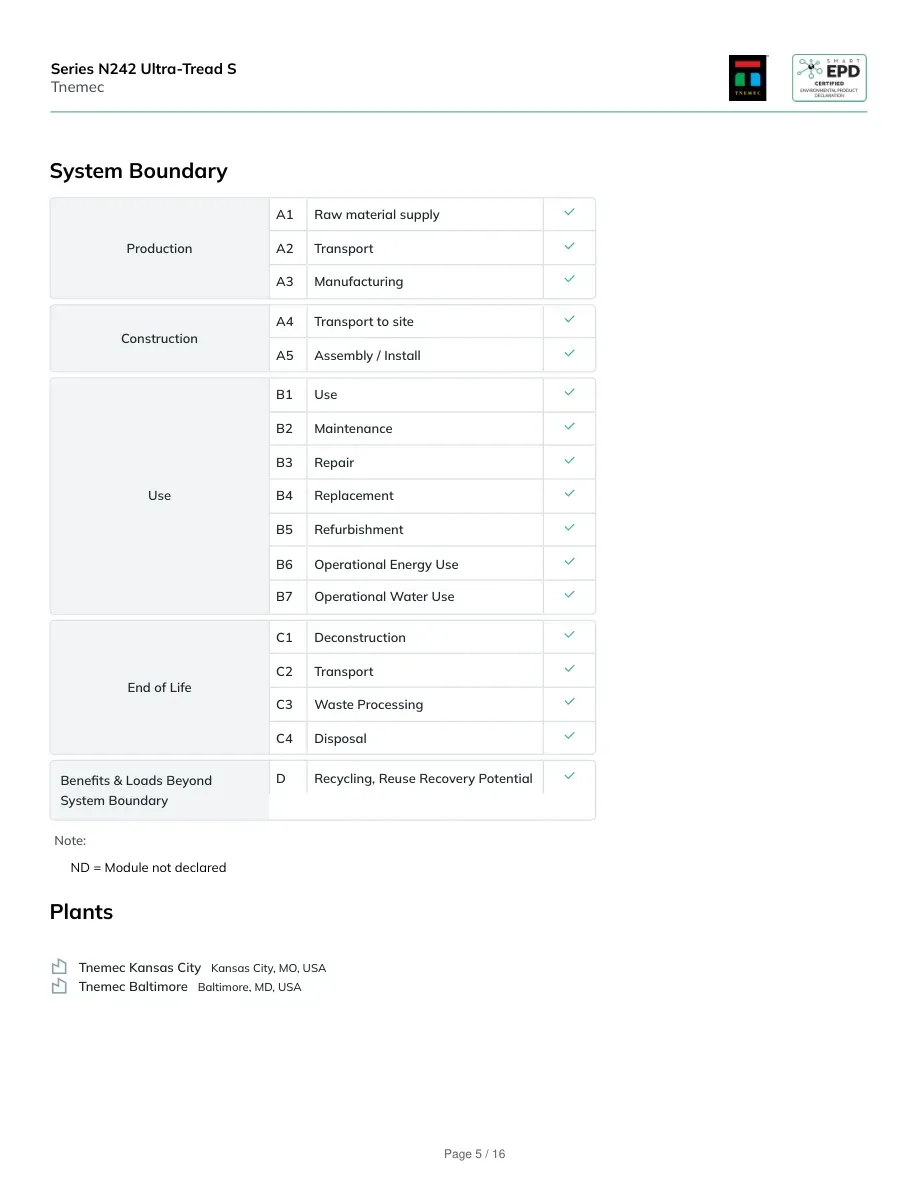
Averaging:Averaging was not conducted for this EPDSystem BoundaryProductionA1Raw material supplyA2TransportA3ManufacturingConstructionA4Transport to siteA5Assembly / InstallUseB1UseB2MaintenanceB3RepairB4ReplacementB5RefurbishmentB6Operational Energy UseB7Operational Water UseEnd of LifeC1DeconstructionC2TransportC3Waste ProcessingC4DisposalBenefits & Loads BeyondSystem BoundaryDRecycling, Reuse Recovery PotentialNote:ND = Module not declaredPlantsTnemec BaltimoreBaltimore, MD, USATnemec123 West 23rd Avenue, North Kansas City, Missouri 64116, USASeries N242 Ultra-Tread STnemecPage 5 / 18
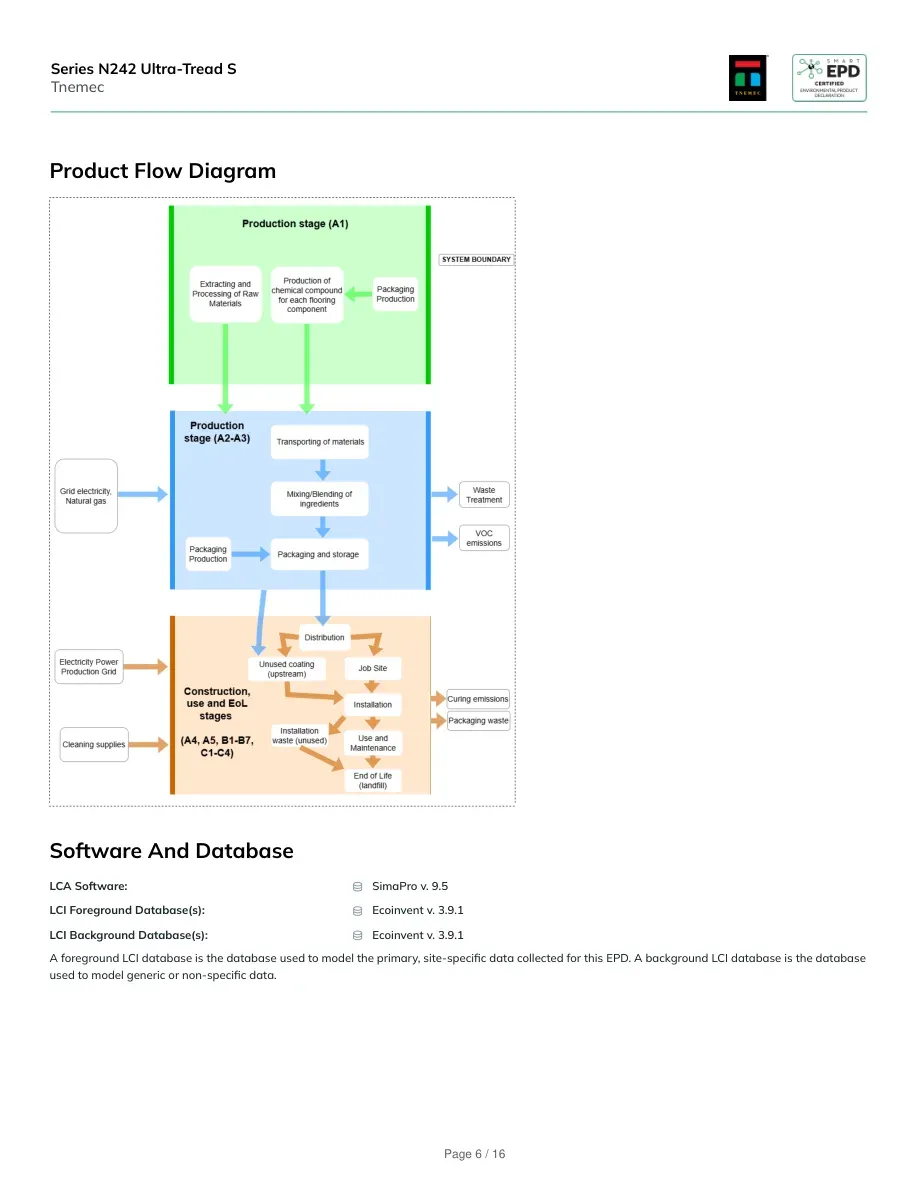
Product Flow DiagramSoftware And DatabaseLCA Software:SimaPro v. 9.5LCI Foreground Database(s):Ecoinvent v. 3.9.1LCI Background Database(s):Ecoinvent v. 3.9.1A foreground LCI database is the database used to model the primary, site-specific data collected for this EPD. A background LCI database is the databaseused to model generic or non-specific data.Series N242 Ultra-Tread STnemecPage 6 / 18
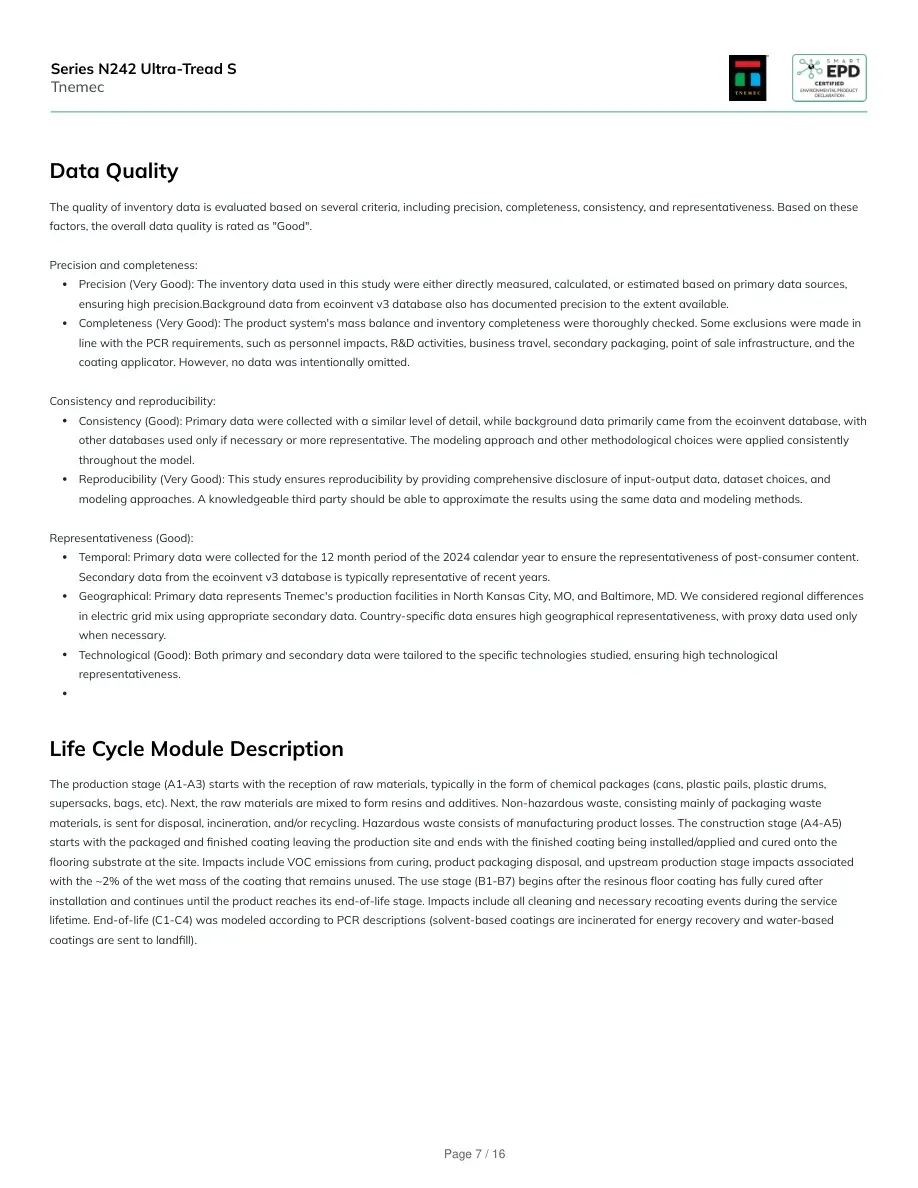
Data QualityThe quality of inventory data is evaluated based on several criteria, including precision, completeness, consistency, and representativeness. Based on thesefactors, the overall data quality is rated as "Good".Precision and completeness:Precision (Very Good): The inventory data used in this study were either directly measured, calculated, or estimated based on primary data sources,ensuring high precision.Background data from ecoinvent v3 database also has documented precision to the extent available.Completeness (Very Good): The product system's mass balance and inventory completeness were thoroughly checked. Some exclusions were made inline with the PCR requirements, such as personnel impacts, R&D activities, business travel, secondary packaging, point of sale infrastructure, and thecoating applicator. However, no data was intentionally omitted.Consistency and reproducibility:Consistency (Good): Primary data were collected with a similar level of detail, while background data primarily came from the ecoinvent database, withother databases used only if necessary or more representative. The modeling approach and other methodological choices were applied consistentlythroughout the model.Reproducibility (Very Good): This study ensures reproducibility by providing comprehensive disclosure of input-output data, dataset choices, andmodeling approaches. A knowledgeable third party should be able to approximate the results using the same data and modeling methods.Representativeness (Good):Temporal: Primary data were collected for the 12 month period of the 2024 calendar year to ensure the representativeness of post-consumer content.Secondary data from the ecoinvent v3 database is typically representative of recent years.Geographical: Primary data represents Tnemec's production facilities in North Kansas City, MO, and Baltimore, MD. We considered regional differencesin electric grid mix using appropriate secondary data. Country-specific data ensures high geographical representativeness, with proxy data used onlywhen necessary.Technological (Good): Both primary and secondary data were tailored to the specific technologies studied, ensuring high technologicalrepresentativeness.Life Cycle Module DescriptionThe production stage (A1-A3) starts with the reception of raw materials, typically in the form of chemical packages (cans, plastic pails, plastic drums,supersacks, bags, etc). Next, the raw materials are mixed to form resins and additives. Non-hazardous waste, consisting mainly of packaging wastematerials, is sent for disposal, incineration, and/or recycling. Hazardous waste consists of manufacturing product losses. The construction stage (A4-A5)starts with the packaged and finished coating leaving the production site and ends with the finished coating being installed/applied and cured onto theflooring substrate at the site. Impacts include VOC emissions from curing, product packaging disposal, and upstream production stage impacts associatedwith the ~2% of the wet mass of the coating that remains unused. The use stage (B1-B7) begins after the resinous floor coating has fully cured afterinstallation and continues until the product reaches its end-of-life stage. Impacts include all cleaning and necessary recoating events during the servicelifetime. End-of-life (C1-C4) was modeled according to PCR descriptions (solvent-based coatings are incinerated for energy recovery and water-basedcoatings are sent to landfill).Series N242 Ultra-Tread STnemecPage 7 / 18
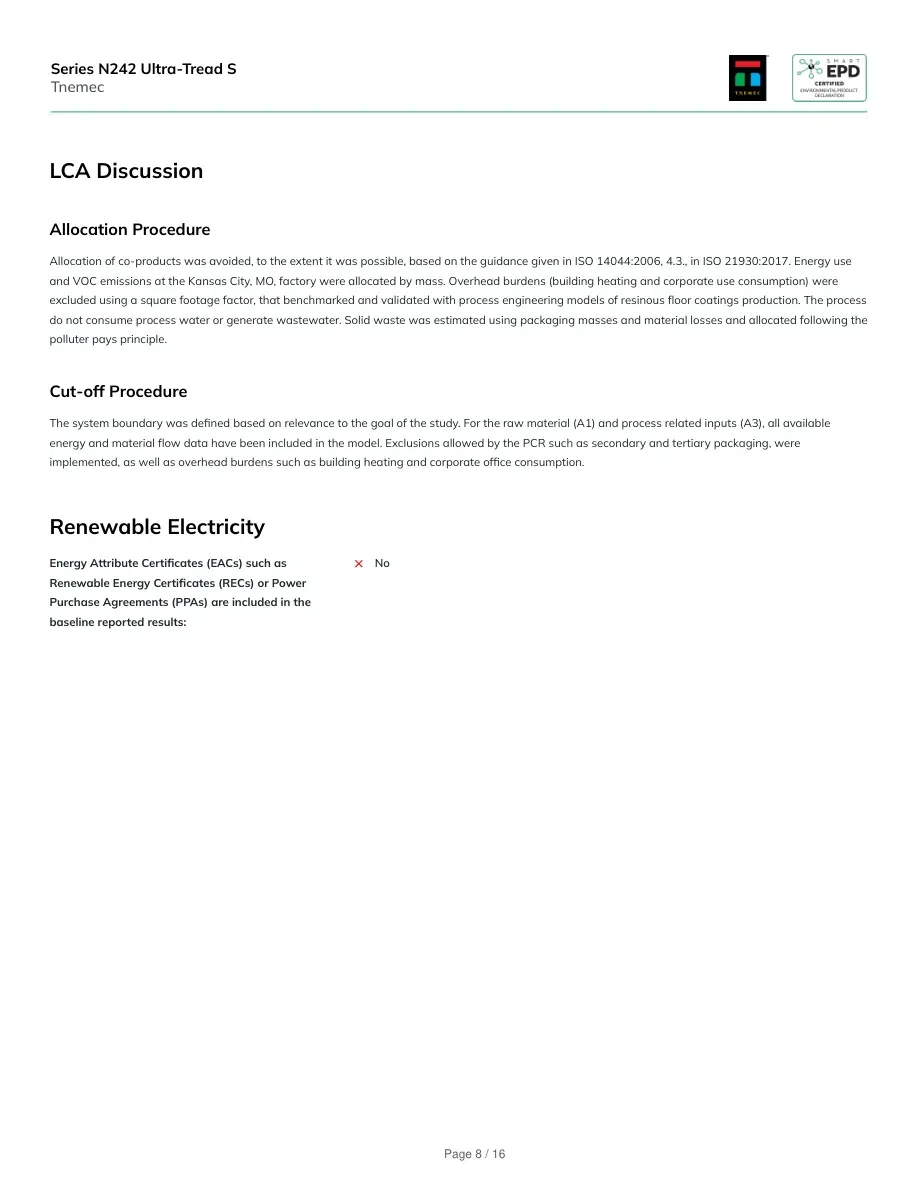
LCA DiscussionAllocation ProcedureAllocation of co-products was avoided, to the extent it was possible, based on the guidance given in ISO 14044:2006, 4.3., in ISO 21930:2017. Energy useand VOC emissions at the North Kansas City, MO, factory were allocated by mass. Overhead burdens (building heating and corporate use consumption)were excluded using a square footage factor, that benchmarked and validated with process engineering models of resinous floor coatings production. Theprocess do not consume process water or generate wastewater. Solid waste was estimated using packaging masses and material losses and allocatedfollowing the polluter pays principle.Cut-off ProcedureThe system boundary was defined based on relevance to the goal of the study. For the raw material (A1) and process related inputs (A3), all availableenergy and material flow data have been included in the model. Exclusions allowed by the PCR such as secondary and tertiary packaging, wereimplemented, as well as overhead burdens such as building heating and corporate office consumption.Renewable ElectricityEnergy Attribute Certificates (EACs) such asRenewable Energy Certificates (RECs) or PowerPurchase Agreements (PPAs) are included in thebaseline reported results:NoScenariosTransport to the building/construction site (A4)A4 ModuleFuel Type:DieselVehicle Type:Truck and TrailerTransport Distance:1214 kmCapacity Utilization:33 %Packaging Mass:3.163 kgWeight of products transported:15.08 kgCapacity utilization volume factor:1Assumptions for scenario development:Transport distance includes finished product to distribution center and distribution center to pointof sale.Installation in to the building/construction site (A5)A5 ModuleInstallation Scrap Rate Assumed:2 %Product Lost per Declared/Functional Unit:0.2383 kgSeries N242 Ultra-Tread STnemecPage 8 / 18
Mass of Packaging Waste Specified by Type:3.163 kgAssumptions for scenario development:Impacts from 2% of unused product, product curing and packaging waste disposalUse (B1)B1 ModuleDeclared Product Properties:Once the product is cured, the use stage starts. No impacts associated with this module have been calculated.Maintenance (B2)B2 ModuleMaintenance Cycle:220 Cycles/RSL73 Cycles/ESLNet Fresh Water Consumption Specified by WaterSource and Fate:0.83 m3Ancillary Materials Specified by Type:1.32 kgFurther assumptions for scenario development:As per the PCR, "220 cleaning events shall be reported in module B2 of the LCA and subsequentEPD." The cleaning solution contains 2.5% of a nonionic surfactant.Repair (B3)B3 ModuleRepair Process Information:No repair impacts assumed as per PCR guidanceReplacement (B4)B4 ModuleReference Service Life:20 YearsReplacement Cycle:2 (ESL/RSL)-1Replacement of Worn Parts:23.83 kgFurther assumptions for scenario development:Values assume market service lifeRefurbishment (B5)B5 ModuleRefurbishment Process Description:No refurbishment impacts assumed as per PCR guidanceOperational Energy Use (B6) & Operational Water Use (B7)B6 & B7 ModulesFurther assumptions for scenario development:No operational energy and water use as per PCR guidanceSeries N242 Ultra-Tread STnemecPage 9 / 18
End of Life (C1 - C4)C1 - C4 ModulesCollection ProcessCollected Separately:0.71 kgCollected with Mixed Construction Waste:35.74 kgRecoveryLandfill:35.74 kgIncineration:0.71 kgAssumptions for scenario development:End-of-life (C1-C4) was modeled according to PCR descriptions. The applied product is assumed to be landfilled with building demolition waste. Unusedcoatings are managed as follows: solvent-based coatings are incinerated for energy recovery, and water-based coatings are sent to landfill.Reuse, Recovery and / or Recycling Potentials & Relevant Scenario Information (D)D ModuleNet Energy Benefit from Energy Recovery fromWaste Treatment Declared as Export Energy inC3:13.14 MJProcess and Conversion Efficiencies:According to the ecoinvent 3.9.1 process “treatment of waste paint,” the incineration of unusedproduct at installation achieves a gross thermal efficiency of 74.4% and a gross electricalefficiency of 10%.Series N242 Ultra-Tread STnemecPage 10 / 18
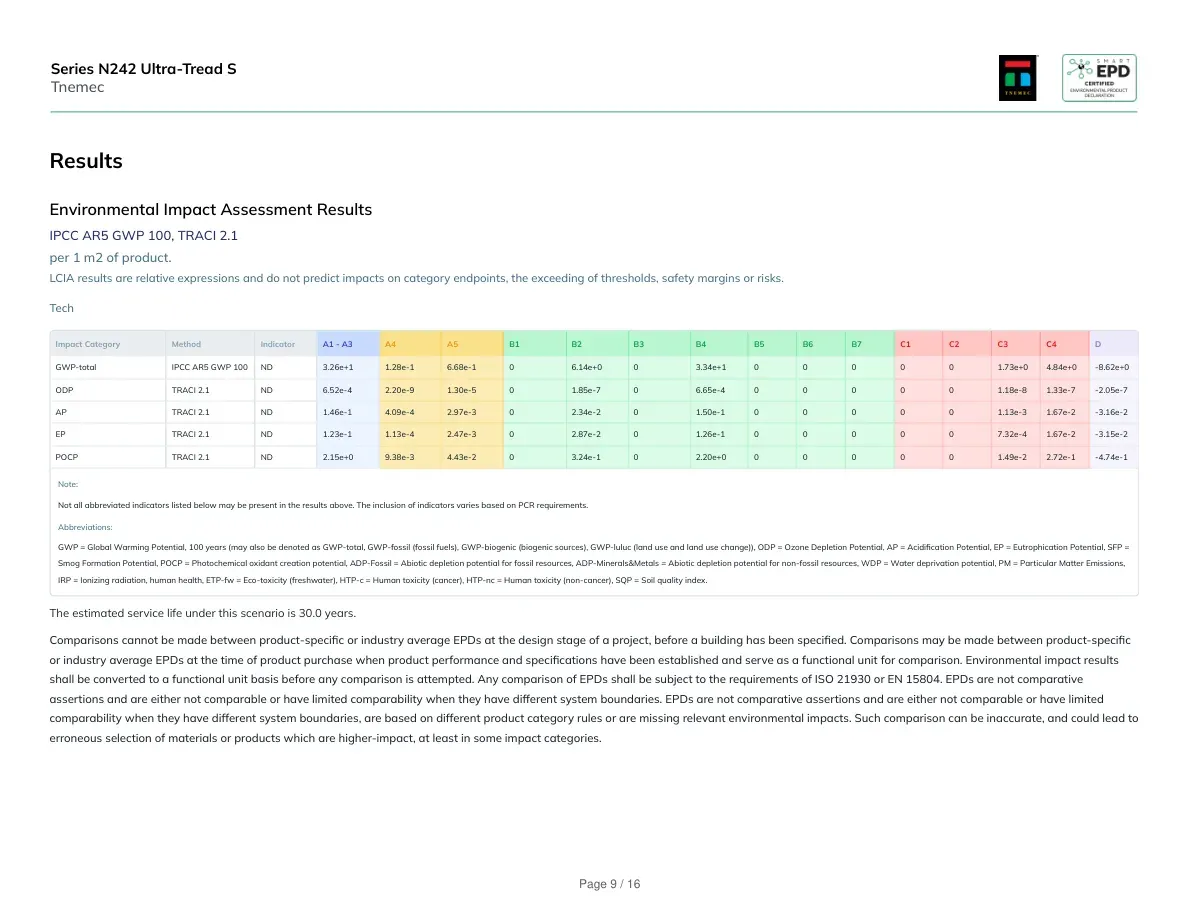
ResultsEnvironmental Impact Assessment ResultsIPCC AR5 GWP 100, TRACI 2.1per 1 m2 of product.LCIA results are relative expressions and do not predict impacts on category endpoints, the exceeding of thresholds, safety margins or risks.TechImpact CategoryUnitMethodA1 - A3A4A5B1B2B3B4B5B6B7C1C2C3C4DGWP-totalkg CO2-eqIPCC AR5GWP 1003.26e+11.28e-16.68e-106.14e+003.34e+1000001.73e+04.84e+0-8.62e+0ODPkg CFC-11 eqTRACI 2.16.52e-42.20e-91.30e-501.85e-706.65e-4000001.18e-81.33e-7-2.05e-7APkg SO2 eqTRACI 2.11.46e-14.09e-42.97e-302.34e-201.50e-1000001.13e-31.67e-2-3.16e-2EPkg N eqTRACI 2.11.23e-11.13e-42.47e-302.87e-201.26e-1000007.32e-41.67e-2-3.15e-2POCPkg O3 eqTRACI 2.12.15e+09.38e-34.43e-203.24e-102.20e+0000001.49e-22.72e-1-4.74e-1Note:Not all abbreviated indicators listed below may be present in the results above. The inclusion of indicators varies based on PCR requirements.Abbreviations:GWP = Global Warming Potential, 100 years (may also be denoted as GWP-total, GWP-fossil (fossil fuels), GWP-biogenic (biogenic sources), GWP-luluc (land use and land use change)), ODP = Ozone Depletion Potential, AP = Acidification Potential, EP = Eutrophication Potential, SFP =Smog Formation Potential, POCP = Photochemical oxidant creation potential, ADP-Fossil = Abiotic depletion potential for fossil resources, ADP-Minerals&Metals = Abiotic depletion potential for non-fossil resources, WDP = Water deprivation potential, PM = Particular Matter Emissions,IRP = Ionizing radiation, human health, ETP-fw = Eco-toxicity (freshwater), HTP-c = Human toxicity (cancer), HTP-nc = Human toxicity (non-cancer), SQP = Soil quality index.The estimated service life under this scenario is 30.0 years.Series N242 Ultra-Tread STnemecPage 11 / 18
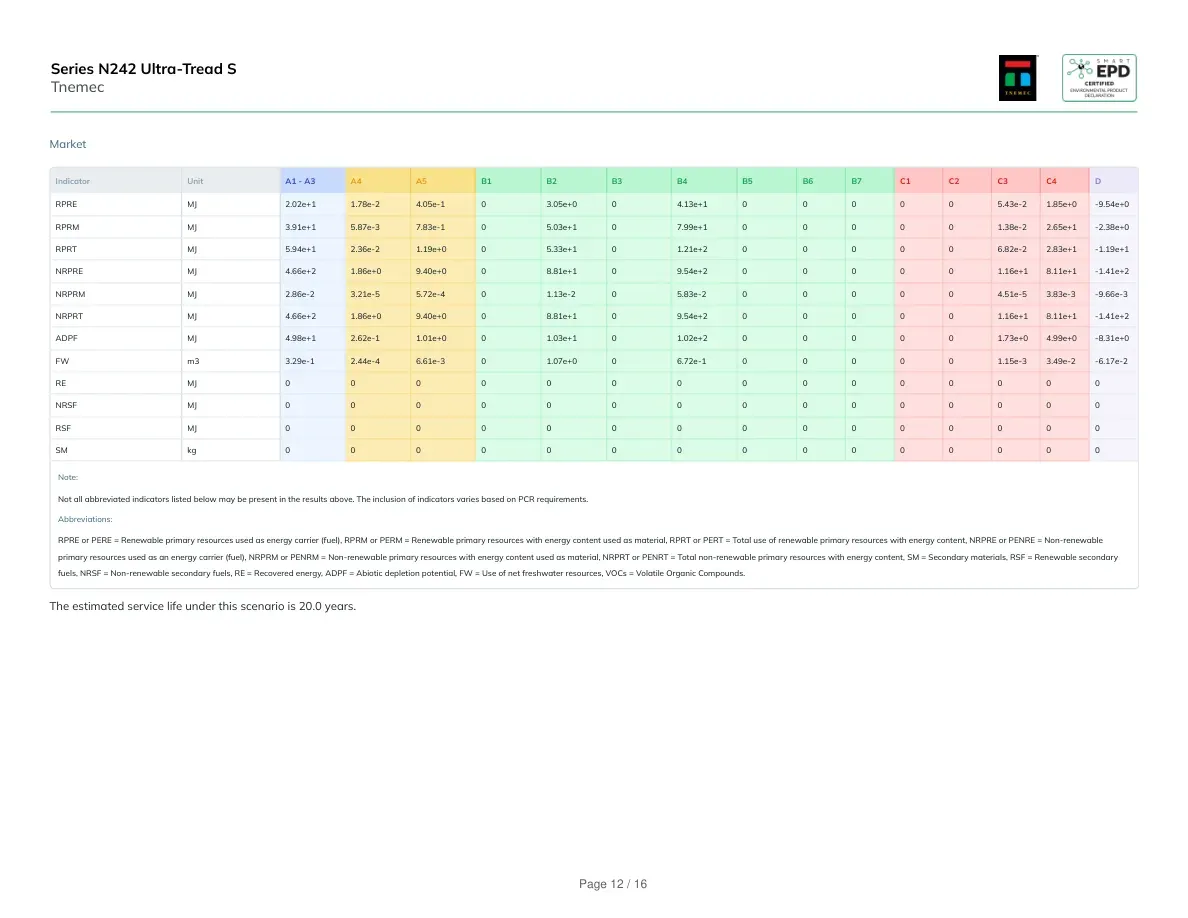
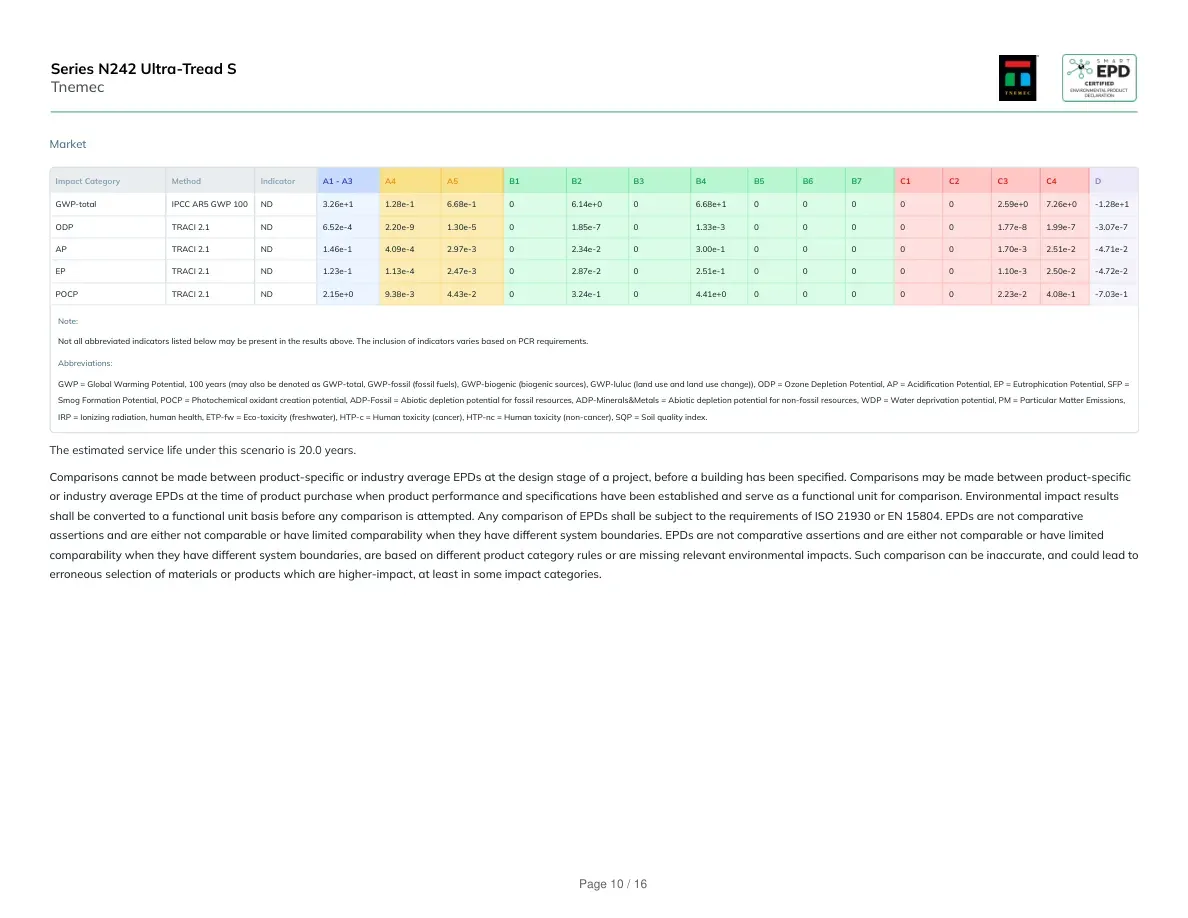
MarketImpact CategoryUnitMethodA1 - A3A4A5B1B2B3B4B5B6B7C1C2C3C4DGWP-totalkg CO2-eqIPCC AR5GWP 1003.26e+11.28e-16.68e-106.14e+006.68e+1000002.59e+07.26e+0-1.28e+1ODPkg CFC-11 eqTRACI 2.16.52e-42.20e-91.30e-501.85e-701.33e-3000001.77e-81.99e-7-3.07e-7APkg SO2 eqTRACI 2.11.46e-14.09e-42.97e-302.34e-203.00e-1000001.70e-32.51e-2-4.71e-2EPkg N eqTRACI 2.11.23e-11.13e-42.47e-302.87e-202.51e-1000001.10e-32.50e-2-4.72e-2POCPkg O3 eqTRACI 2.12.15e+09.38e-34.43e-203.24e-104.41e+0000002.23e-24.08e-1-7.03e-1Note:Not all abbreviated indicators listed below may be present in the results above. The inclusion of indicators varies based on PCR requirements.Abbreviations:GWP = Global Warming Potential, 100 years (may also be denoted as GWP-total, GWP-fossil (fossil fuels), GWP-biogenic (biogenic sources), GWP-luluc (land use and land use change)), ODP = Ozone Depletion Potential, AP = Acidification Potential, EP = Eutrophication Potential, SFP =Smog Formation Potential, POCP = Photochemical oxidant creation potential, ADP-Fossil = Abiotic depletion potential for fossil resources, ADP-Minerals&Metals = Abiotic depletion potential for non-fossil resources, WDP = Water deprivation potential, PM = Particular Matter Emissions,IRP = Ionizing radiation, human health, ETP-fw = Eco-toxicity (freshwater), HTP-c = Human toxicity (cancer), HTP-nc = Human toxicity (non-cancer), SQP = Soil quality index.The estimated service life under this scenario is 20.0 years.Series N242 Ultra-Tread STnemecPage 12 / 18
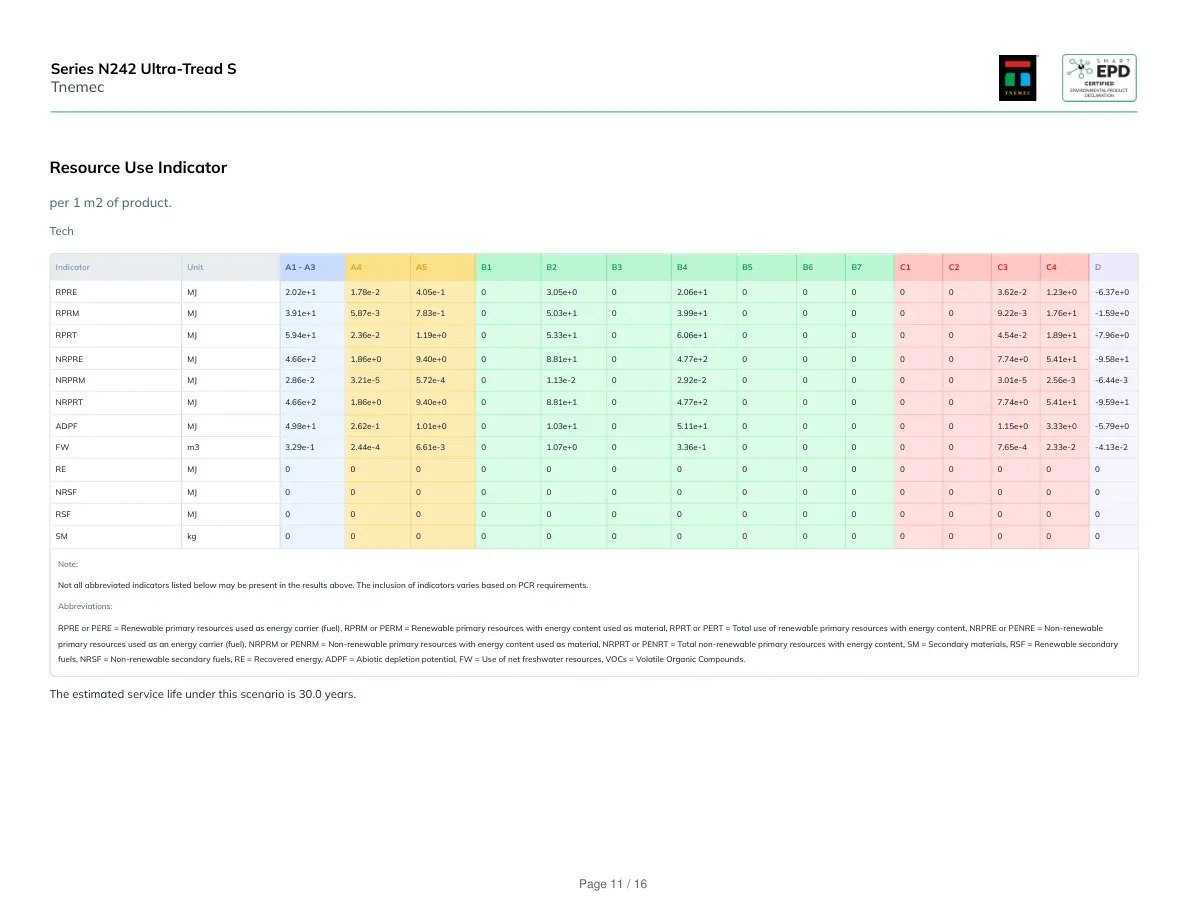
Resource Use Indicatorper 1 m2 of product.TechIndicatorUnitA1 - A3A4A5B1B2B3B4B5B6B7C1C2C3C4DRPREMJ2.02e+11.78e-24.05e-103.05e+002.06e+1000003.62e-21.23e+0-6.37e+0RPRMMJ3.91e+15.87e-37.83e-105.03e+103.99e+1000009.22e-31.76e+1-1.59e+0RPRTMJ5.94e+12.36e-21.19e+005.33e+106.06e+1000004.54e-21.89e+1-7.96e+0NRPREMJ4.66e+21.86e+09.40e+008.81e+104.77e+2000007.74e+05.41e+1-9.58e+1NRPRMMJ2.86e-23.21e-55.72e-401.13e-202.92e-2000003.01e-52.56e-3-6.44e-3NRPRTMJ4.66e+21.86e+09.40e+008.81e+104.77e+2000007.74e+05.41e+1-9.59e+1ADPFMJ4.98e+12.62e-11.01e+001.03e+105.11e+1000001.15e+03.33e+0-5.79e+0FWm33.29e-12.44e-46.61e-301.07e+003.36e-1000007.65e-42.33e-2-4.13e-2REMJ000000000000000NRSFMJ000000000000000RSFMJ000000000000000SMkg000000000000000Note:Not all abbreviated indicators listed below may be present in the results above. The inclusion of indicators varies based on PCR requirements.Abbreviations:RPRE or PERE = Renewable primary resources used as energy carrier (fuel), RPRM or PERM = Renewable primary resources with energy content used as material, RPRT or PERT = Total use of renewable primary resources with energy content, NRPRE or PENRE = Non-renewableprimary resources used as an energy carrier (fuel), NRPRM or PENRM = Non-renewable primary resources with energy content used as material, NRPRT or PENRT = Total non-renewable primary resources with energy content, SM = Secondary materials, RSF = Renewable secondaryfuels, NRSF = Non-renewable secondary fuels, RE = Recovered energy, ADPF = Abiotic depletion potential, FW = Use of net freshwater resources, VOCs = Volatile Organic Compounds.The estimated service life under this scenario is 30.0 years.Series N242 Ultra-Tread STnemecPage 13 / 18
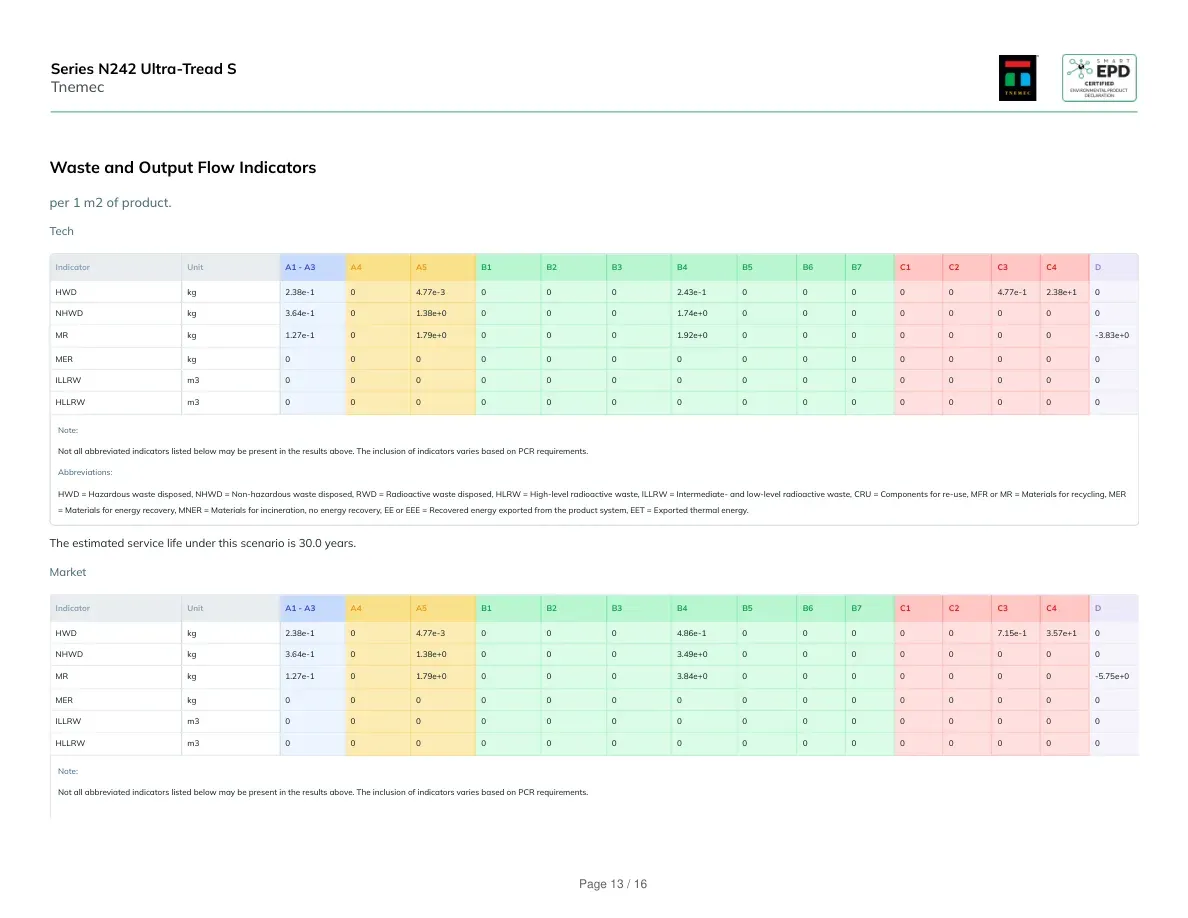
MarketIndicatorUnitA1 - A3A4A5B1B2B3B4B5B6B7C1C2C3C4DRPREMJ2.02e+11.78e-24.05e-103.05e+004.13e+1000005.43e-21.85e+0-9.54e+0RPRMMJ3.91e+15.87e-37.83e-105.03e+107.99e+1000001.38e-22.65e+1-2.38e+0RPRTMJ5.94e+12.36e-21.19e+005.33e+101.21e+2000006.82e-22.83e+1-1.19e+1NRPREMJ4.66e+21.86e+09.40e+008.81e+109.54e+2000001.16e+18.11e+1-1.41e+2NRPRMMJ2.86e-23.21e-55.72e-401.13e-205.83e-2000004.51e-53.83e-3-9.66e-3NRPRTMJ4.66e+21.86e+09.40e+008.81e+109.54e+2000001.16e+18.11e+1-1.41e+2ADPFMJ4.98e+12.62e-11.01e+001.03e+101.02e+2000001.73e+04.99e+0-8.31e+0FWm33.29e-12.44e-46.61e-301.07e+006.72e-1000001.15e-33.49e-2-6.17e-2REMJ000000000000000NRSFMJ000000000000000RSFMJ000000000000000SMkg000000000000000Note:Not all abbreviated indicators listed below may be present in the results above. The inclusion of indicators varies based on PCR requirements.Abbreviations:RPRE or PERE = Renewable primary resources used as energy carrier (fuel), RPRM or PERM = Renewable primary resources with energy content used as material, RPRT or PERT = Total use of renewable primary resources with energy content, NRPRE or PENRE = Non-renewableprimary resources used as an energy carrier (fuel), NRPRM or PENRM = Non-renewable primary resources with energy content used as material, NRPRT or PENRT = Total non-renewable primary resources with energy content, SM = Secondary materials, RSF = Renewable secondaryfuels, NRSF = Non-renewable secondary fuels, RE = Recovered energy, ADPF = Abiotic depletion potential, FW = Use of net freshwater resources, VOCs = Volatile Organic Compounds.The estimated service life under this scenario is 20.0 years.Series N242 Ultra-Tread STnemecPage 14 / 18
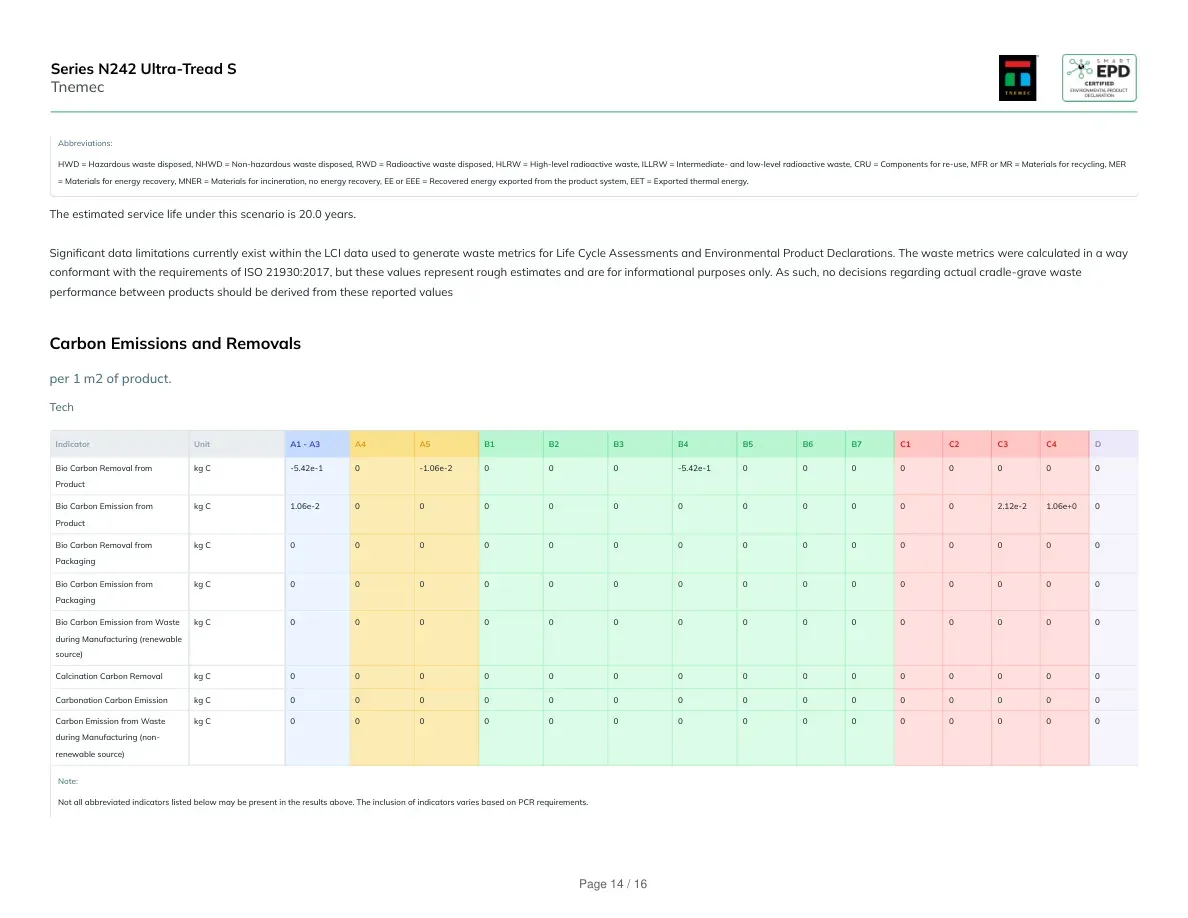
Waste and Output Flow Indicatorsper 1 m2 of product.TechIndicatorUnitA1 - A3A4A5B1B2B3B4B5B6B7C1C2C3C4DHWDkg2.38e-104.77e-30002.43e-1000004.77e-12.38e+10NHWDkg3.64e-101.38e+00001.74e+000000000MRkg1.27e-101.79e+00001.92e+00000000-3.83e+0MERkg000000000000000ILLRWm3000000000000000HLLRWm3000000000000000Note:Not all abbreviated indicators listed below may be present in the results above. The inclusion of indicators varies based on PCR requirements.Abbreviations:HWD = Hazardous waste disposed, NHWD = Non-hazardous waste disposed, RWD = Radioactive waste disposed, HLRW = High-level radioactive waste, ILLRW = Intermediate- and low-level radioactive waste, CRU = Components for re-use, MFR or MR = Materials for recycling, MER= Materials for energy recovery, MNER = Materials for incineration, no energy recovery, EE or EEE = Recovered energy exported from the product system, EET = Exported thermal energy.The estimated service life under this scenario is 30.0 years.MarketIndicatorUnitA1 - A3A4A5B1B2B3B4B5B6B7C1C2C3C4DHWDkg2.38e-104.77e-30004.86e-1000007.15e-13.57e+10NHWDkg3.64e-101.38e+00003.49e+000000000MRkg1.27e-101.79e+00003.84e+00000000-5.75e+0MERkg000000000000000ILLRWm3000000000000000HLLRWm3000000000000000Note:Not all abbreviated indicators listed below may be present in the results above. The inclusion of indicators varies based on PCR requirements.Series N242 Ultra-Tread STnemecPage 15 / 18
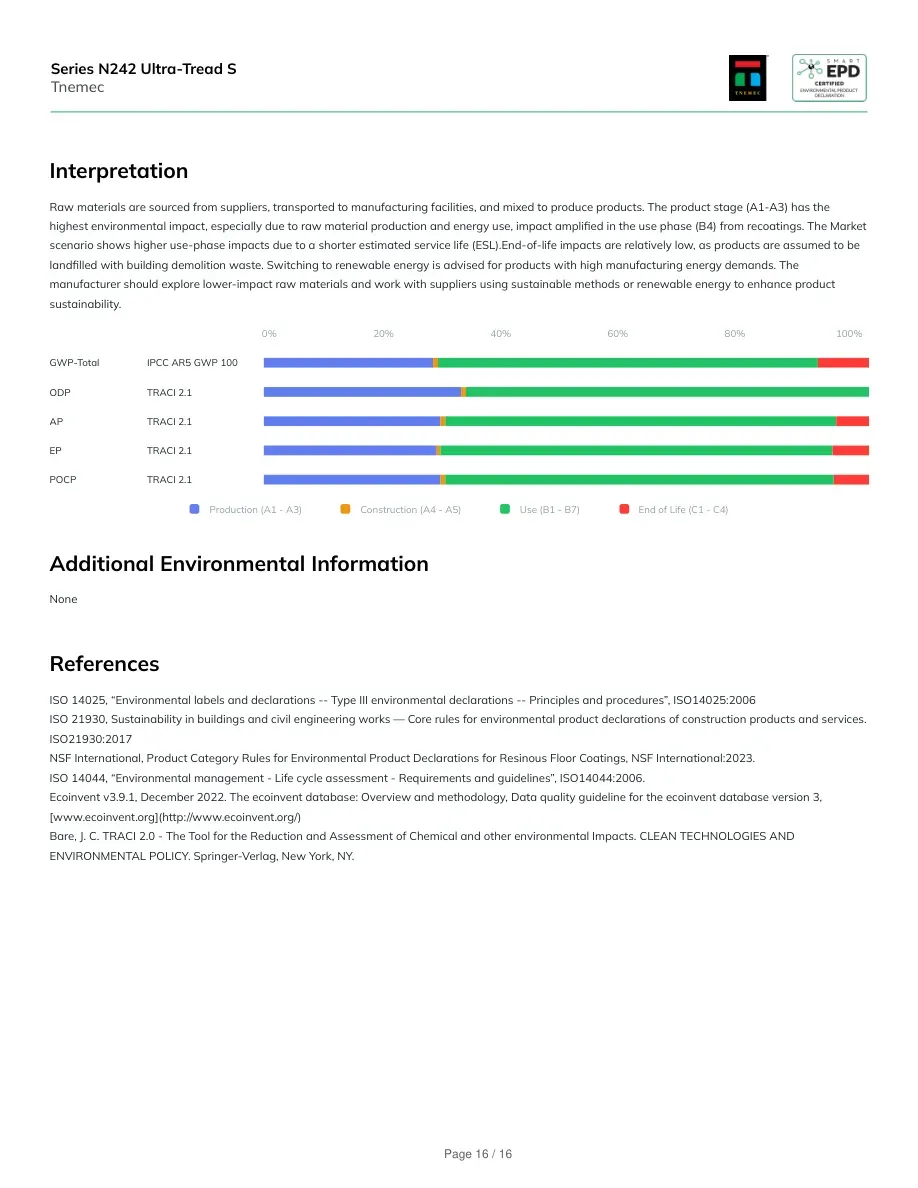
Abbreviations:HWD = Hazardous waste disposed, NHWD = Non-hazardous waste disposed, RWD = Radioactive waste disposed, HLRW = High-level radioactive waste, ILLRW = Intermediate- and low-level radioactive waste, CRU = Components for re-use, MFR or MR = Materials for recycling, MER= Materials for energy recovery, MNER = Materials for incineration, no energy recovery, EE or EEE = Recovered energy exported from the product system, EET = Exported thermal energy.The estimated service life under this scenario is 20.0 years.Significant data limitations currently exist within the LCI data used to generate waste metrics for Life Cycle Assessments and Environmental Product Declarations. The waste metrics were calculated in a wayconformant with the requirements of ISO 21930:2017, but these values represent rough estimates and are for informational purposes only. As such, no decisions regarding actual cradle-grave wasteperformance between products should be derived from these reported valuesCarbon Emissions and Removalsper 1 m2 of product.TechIndicatorUnitA1 - A3A4A5B1B2B3B4B5B6B7C1C2C3C4DBio Carbon Removal fromProductkg C-5.42e-10-1.06e-2000-5.42e-100000000Bio Carbon Emission fromProductkg C1.06e-2000000000002.12e-21.06e+00Bio Carbon Removal fromPackagingkg C000000000000000Bio Carbon Emission fromPackagingkg C000000000000000Bio Carbon Emission from Wasteduring Manufacturing (renewablesource)kg C000000000000000Calcination Carbon Removalkg C000000000000000Carbonation Carbon Emissionkg C000000000000000Carbon Emission from Wasteduring Manufacturing (non-renewable source)kg C000000000000000Note:Not all abbreviated indicators listed below may be present in the results above. The inclusion of indicators varies based on PCR requirements.Series N242 Ultra-Tread STnemecPage 16 / 18
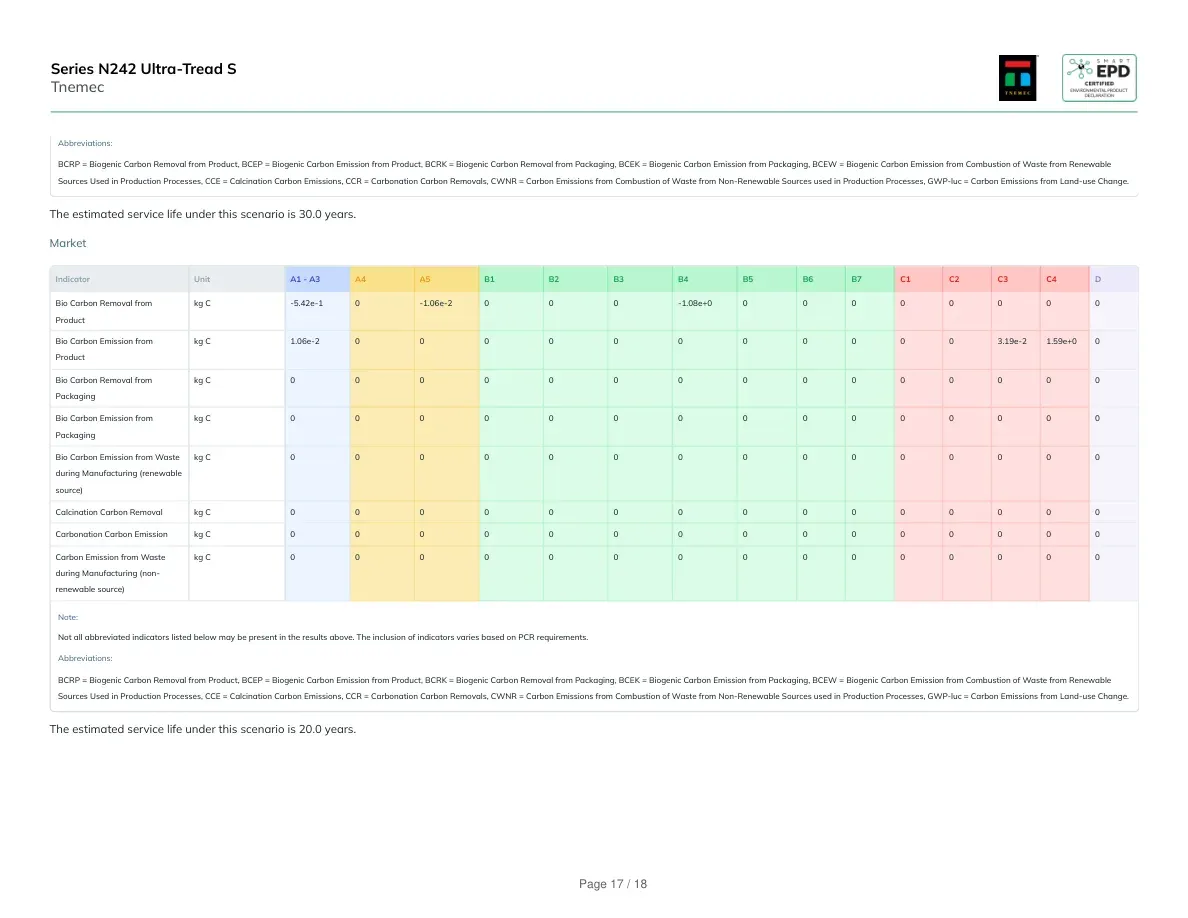
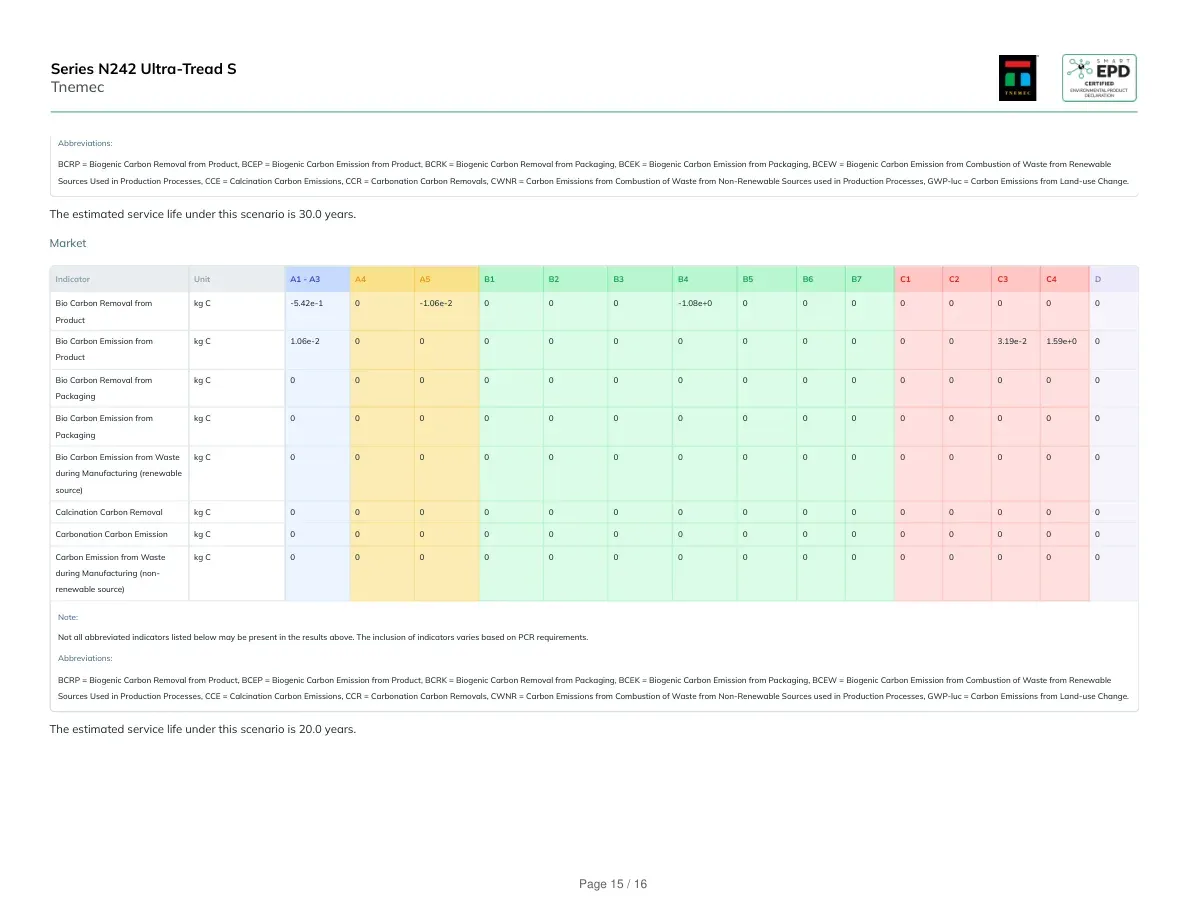
Abbreviations:BCRP = Biogenic Carbon Removal from Product, BCEP = Biogenic Carbon Emission from Product, BCRK = Biogenic Carbon Removal from Packaging, BCEK = Biogenic Carbon Emission from Packaging, BCEW = Biogenic Carbon Emission from Combustion of Waste from RenewableSources Used in Production Processes, CCE = Calcination Carbon Emissions, CCR = Carbonation Carbon Removals, CWNR = Carbon Emissions from Combustion of Waste from Non-Renewable Sources used in Production Processes, GWP-luc = Carbon Emissions from Land-use Change.The estimated service life under this scenario is 30.0 years.MarketIndicatorUnitA1 - A3A4A5B1B2B3B4B5B6B7C1C2C3C4DBio Carbon Removal fromProductkg C-5.42e-10-1.06e-2000-1.08e+000000000Bio Carbon Emission fromProductkg C1.06e-2000000000003.19e-21.59e+00Bio Carbon Removal fromPackagingkg C000000000000000Bio Carbon Emission fromPackagingkg C000000000000000Bio Carbon Emission from Wasteduring Manufacturing (renewablesource)kg C000000000000000Calcination Carbon Removalkg C000000000000000Carbonation Carbon Emissionkg C000000000000000Carbon Emission from Wasteduring Manufacturing (non-renewable source)kg C000000000000000Note:Not all abbreviated indicators listed below may be present in the results above. The inclusion of indicators varies based on PCR requirements.Abbreviations:BCRP = Biogenic Carbon Removal from Product, BCEP = Biogenic Carbon Emission from Product, BCRK = Biogenic Carbon Removal from Packaging, BCEK = Biogenic Carbon Emission from Packaging, BCEW = Biogenic Carbon Emission from Combustion of Waste from RenewableSources Used in Production Processes, CCE = Calcination Carbon Emissions, CCR = Carbonation Carbon Removals, CWNR = Carbon Emissions from Combustion of Waste from Non-Renewable Sources used in Production Processes, GWP-luc = Carbon Emissions from Land-use Change.The estimated service life under this scenario is 20.0 years.Series N242 Ultra-Tread STnemecPage 17 / 18
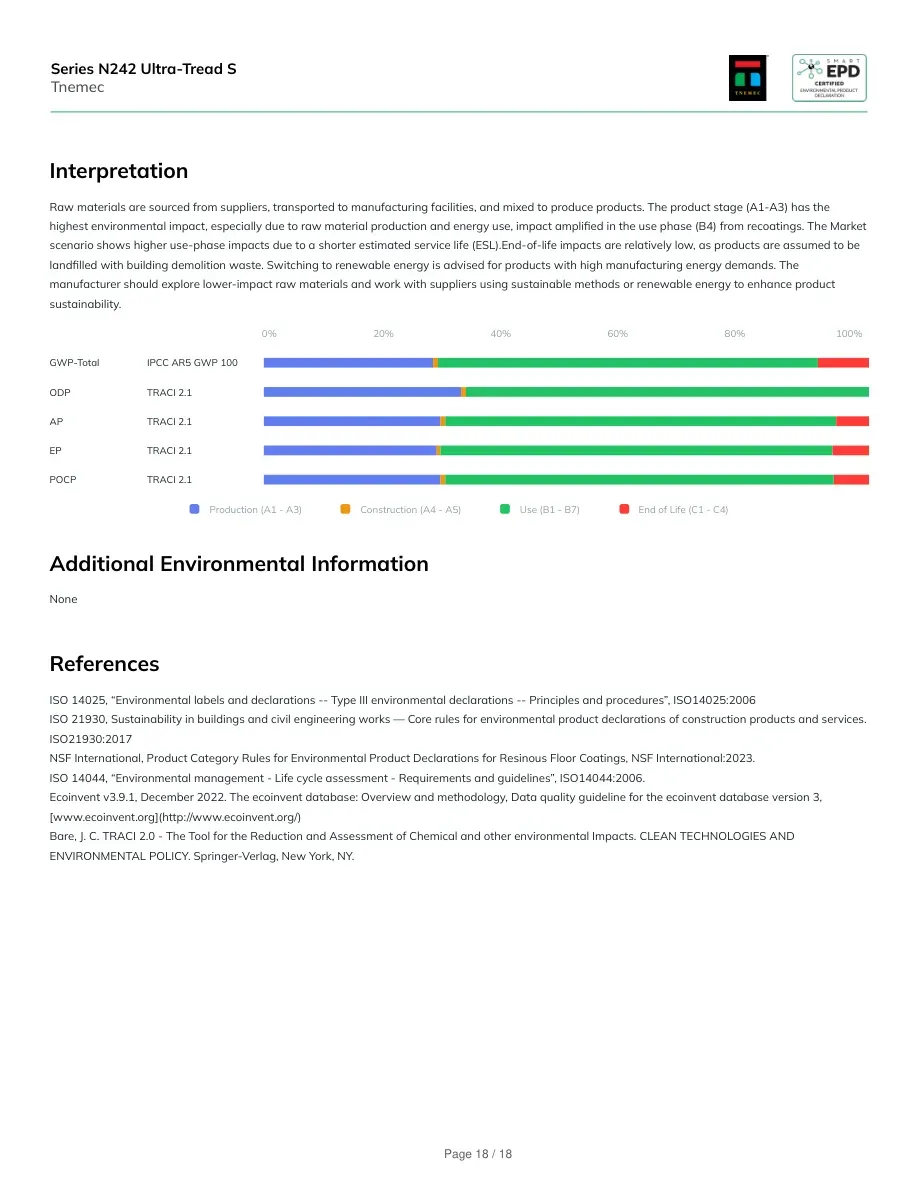
InterpretationRaw materials are sourced from suppliers, transported to manufacturing facilities, and mixed to produce products. The product stage (A1-A3) has thehighest environmental impact, especially due to raw material production and energy use, impact amplified in the use phase (B4) from recoatings. The Marketscenario shows higher use-phase impacts due to a shorter estimated service life (ESL).End-of-life impacts are relatively low, as products are assumed to belandfilled with building demolition waste. Switching to renewable energy is advised for products with high manufacturing energy demands. Themanufacturer should explore lower-impact raw materials and work with suppliers using sustainable methods or renewable energy to enhance productsustainability.0%20%40%60%80%100%GWP-TotalIPCC AR5 GWP 100ODPTRACI 2.1APTRACI 2.1EPTRACI 2.1POCPTRACI 2.1Production (A1 - A3)Construction (A4 - A5)Use (B1 - B7)End of Life (C1 - C4)Additional Environmental InformationNoneReferencesISO 14025, “Environmental labels and declarations -- Type III environmental declarations -- Principles and procedures”, ISO14025:2006ISO 21930, Sustainability in buildings and civil engineering works — Core rules for environmental product declarations of construction products and services.ISO21930:2017NSF International, Product Category Rules for Environmental Product Declarations for Resinous Floor Coatings, NSF International:2023.ISO 14044, “Environmental management - Life cycle assessment - Requirements and guidelines”, ISO14044:2006.Ecoinvent v3.9.1, December 2022. The ecoinvent database: Overview and methodology, Data quality guideline for the ecoinvent database version 3,[www.ecoinvent.org](http://www.ecoinvent.org/)Bare, J. C. TRACI 2.0 - The Tool for the Reduction and Assessment of Chemical and other environmental Impacts. CLEAN TECHNOLOGIES ANDENVIRONMENTAL POLICY. Springer-Verlag, New York, NY.Series N242 Ultra-Tread STnemecPage 18 / 18